Where is the US Consumer? A look beyond the headlines
Recent data related to U.S. Consumers has appeared somewhat inconsistent. Consumer Confidence is high, but retail sales are sluggish. With low unemployment and seemingly healthy consumer balance sheets, many are wondering what has happened to US consumers and why retail sales growth is decelerating. A closer review of the data suggests that consumers may in fact be under more pressure than the headlines alone would indicate.
Headline: Expenses vs after tax income near all-time lows?
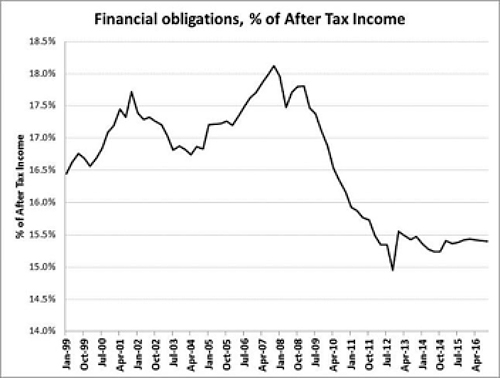
A commonly cited metric estimated by the Federal Reserve, the Financial Obligations Ratio, appears to show that US consumers are on relatively solid ground, with the percent of after-tax income going to “financial obligations” near historically low levels (Chart 1). The ongoing economic recovery and the extended period of low interest rates have helped to reduce this portion of the financial burden on consumers. The Fed defines these obligations to be:
- Housing expense (mortgage, rent, insurance)
- Debt service (e.g. credit cards, auto loans, student loans)
- Additional items (including property tax and auto lease payments)
However, do you have health insurance, a cellphone, and need to eat?
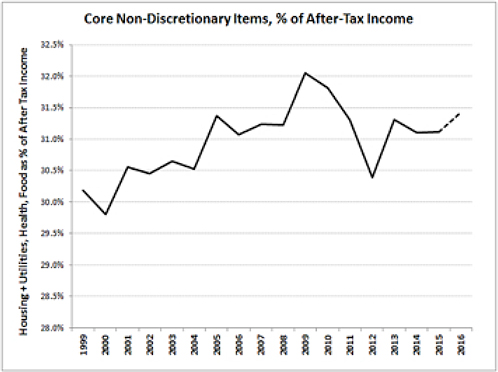
The Financial Obligations Ratio excludes some very significant items that most people consider necessary in today’s world. Using data from the Bureau of Economic Analysis, Middleton & Company has created our own measure of non-discretionary spending as a percent of after tax income that includes not only housing but also utilities, healthcare, and food at home (i.e., not restaurant spending). This metric produces a very different picture, seen below in Chart 2. As Chart 2 shows, the percent of income being spent on these items is nearing the peak levels of ’09-’10, a much different picture of consumer health than the one implied by the Financial Obligations Ratio.
Chart 1: Financial obligations (Fed definition), % of After Tax Income, 1999-2016
Source: Federal Reserve; data through Q4 2016
Chart 2: Non-Discretionary Spending (Middleton definition), % of After Tax Income, 1999-2016
Source: Bureau of Economic Analysis
① Note
It gets even more interesting when you look at the state level dispersion
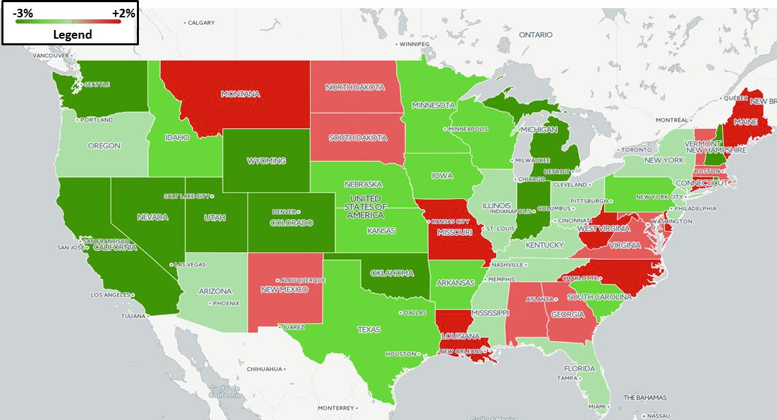
The broader definition of financial burden on US consumers has been growing over time (Chart 2 above) and is only modestly lower than levels seen in ’09-’10. However, this data is aggregate level data for the entire US. When reviewing individual state level data, one finds that for more than 1/3 of states, the burden of these non-discretionary items is actually higher than it was in 2009 (Chart 3). ②
States in pink or red have experienced an increase in non-discretionary expenses as a percent of after tax income as opposed to states in green, where the ratio of such expenses has declined.
Chart 3: Change in Non-Discretionary Expenses as % of After Tax Income, 2015 vs 2009
Source: Bureau of Economic Analysis; map created using CARTO
③ Note
Despite headlines to the contrary, consumers in approximately one-third of states are by some metrics under more financial stress than during the 2009 financial crisis, and this is with a healthy economy and full employment. We see this as a plausible explanation as to why retail sales have been weaker than expected and we believe it is data that warrants close scrutiny. With consumer spending comprising approximately two-thirds of US Gross Domestic Product (GDP), the health of consumers will be a large determinant of growth in the domestic economy.
Endnotes:
① Note: BEA data adjusted to exclude government and employer benefits from income and expenditure to more accurately reflect out of pocket spending. Also excludes minimum payments on consumer debt. The 2016 value is estimated since two benefit line items are not yet available (representing ~15% of the total benefit adjustment)
② Note: This data is as of 2015, the latest year of state level personal consumption expenditure data available
③ Note: BEA data unadjusted since data on benefits are not all known at the state level


 Company, Inc.